Can the walls withstand shaking? Can the roof withstand the high winds? Is the area around the home free of items that can catch fire from a flying ember? Will the neighbors be able to help each other respond and recover?
If you know the risks, you are less likely to suffer a loss of possessions. Or property. Or life and limb.
According to experts, 90% of all rescues in major disasters are performed by family and neighbors. The first step in preparing for disasters is for the members of a household and a community to understand what disasters can happen where they live. Here are a few tools to check your risk for a disaster.
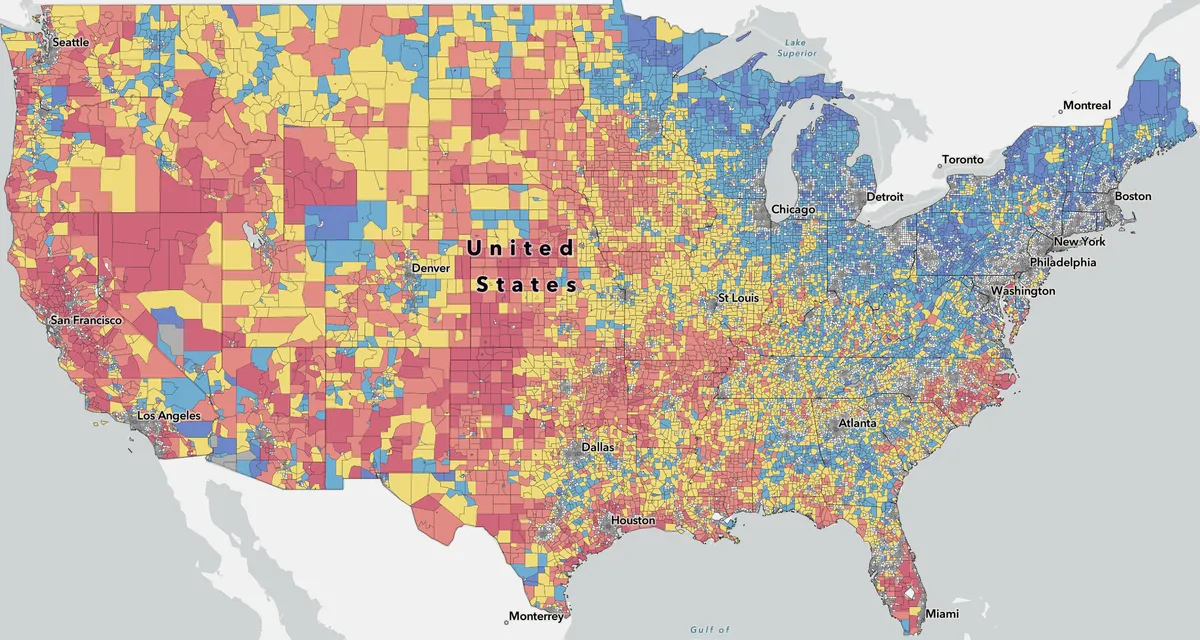
National Risk Index
The National Risk Index is a free online tool created by the Federal Government that lists 18 natural hazards and their likelihood in every community in the country. Just put in your zip code in the National Risk Index and it will give you information on the disasters your community is at risk for as well as the recovery strategy.
Let's try to understand the information from this tool better by comparing risks to neighborhoods.
Two Cities: Different Disaster Risks to Home and Communities
| |
Miami |
Seattle |
| Risk Index Map |

|

|
| Natural Hazard Risk |
Very High |
Relatively High |
| Major Risk From |
Flooding (Coastal & River)
Hurricanes
Lightning
Tornadoes
Cold Weather
|
Volcanic Activity
Flooding (Coastal)
Avalanche
Earthquake
|
The obvious takeaway from these two very different kinds of risk profiles is that you will be getting ready for different kinds of disasters in Miami vs. Seattle. What might not be as obvious are higher risks for natural hazards that are not commonly associated with Miami (cold weather) or in parts of Seattle (avalanche).
Two Cities: Different Ability to Prepare, Adapt, Withstand, and Recover
| |
New Orleans |
Los Angeles |
| Community Resilience Map |
 |
 |
| Community Resilience Score |
Very High |
Relatively Low |
| Compared to All of USA |
3.7% of U.S. counties have a higher Community Resilience than New Orleans. |
82.4% of U.S. counties have a higher Community Resilience |
It is pleasantly surprising to learn that neighborhoods in New Orleans have a very high ability to be ready for natural hazards, and withstand and recover rapidly from disruptions. And that less than 4% of counties across the US have better community resilience.
Flood Risk
This free flood map service is provided by the Federal Government, and shows the risk of flood to your home. The high-risk flood areas begin with the letters A or V on these flood maps. The moderate- to low-risk flood areas are designated with the letters B, C, and X. In these areas, the risk of being flooded is reduced, but not completely removed. One in three insurance claims come from moderate- to low-risk flood areas. Note that the results from a search on this tool are not easy to understand, but it can be helpful to ask about flood zones when talking to your home insurance provider.
Risk Factor
Risk Factor is a free online tool created by a nonprofit organization to find your home’s risk from three environmental threats: flooding, wildfires, and extreme heat. It shows your risk today, and how it may change in the future.
Up to Code
Is your building up to code? That is a risk not from the disaster, but a measurement of your home’s ability to withstand a disaster. Two out of three buildings prone to severe weather don’t have the building codes they need.
Put in your address in this online tool and see if your building is up to code. This tool, built by a non-profit from a Department of Homeland Security grant, shows that even the White House is in a neighborhood that is NOT up to date with its building codes.

Bottomline
In less than 15 minutes, you can use multiple online tools to understand the risk of natural hazards to your home and community. Next you can start preparing for disasters anticipated from these hazards.


