How much awareness do you have of flooding?


It is the most frequent natural disaster in United States.


Memories with flooding are always devastating, from property losses to impact on people's lives. Each year, heavy rains, hurricanes, and rising sea levels result in substantial financial losses, leaving families struggling to recover from the aftermath. Both governments and individuals bear a heavy financial burden because of it.


Beyond the numbers, we aim to share the real stories and feelings of those who have faced the harsh realities of flooding, illustrating their struggles and resilience. In the historical overview of significant floods that have shaped the life of the nation, emphasizing the urgent need for awareness and preparedness in the face of this growing threat.


First, let's take a look at the financial losses during the floods, as it's one of the most telling indicators of the severity of floods is the financial loss they inflict.


Below, we explore the top 10 states with the most significant financial impacts from flooding. Based on data from fiscal year 2024, while flooding is impacting the entire nation, the bar chart below emphasizes the top 10 states with the greatest financial burdens, showing the number of records for closed losses with payment, closed losses without payment, and open losses (active claims still unresolved).


Please hover or zoom in the bar chart for more details.

Data Source: NFIP Claims Data Financial Losses by State

Texas and Florida lead the list in terms of claims, but notably, Iowa, with fewer than one-tenth the claims of these states, still ranks 10th in recovery costs.


Here we delve into the specific financial impacts on individuals and businesses within these states. The chart below illustrates detailing loss payments categorized by different occupancy and business groups. Additionally, it highlights the individual payouts in policies, separating it into building coverage, content coverage, and both categories. By examining these factors, we gain insight into not only the magnitude of financial losses but also how well residents and businesses are protected against the aftermath of flooding.


This data serves as a crucial reminder of the need for comprehensive insurance policies and proactive measures to mitigate the financial burdens that come with flooding. Understanding these individual loss payments and coverage details helps inform future policies and preparedness efforts aimed at supporting affected communities.


Please click the parts you are interested in to check more details.

Data Source: NFIP Claims Data Policy and Loss Statistics by Flood Zone

As flooding poses significant challenges across the U.S., it's crucial to recognize that many of these floods are triggered by severe weather events, especially hurricanes, which bring destructive winds and torrential rain.

the thrid gif coming soon

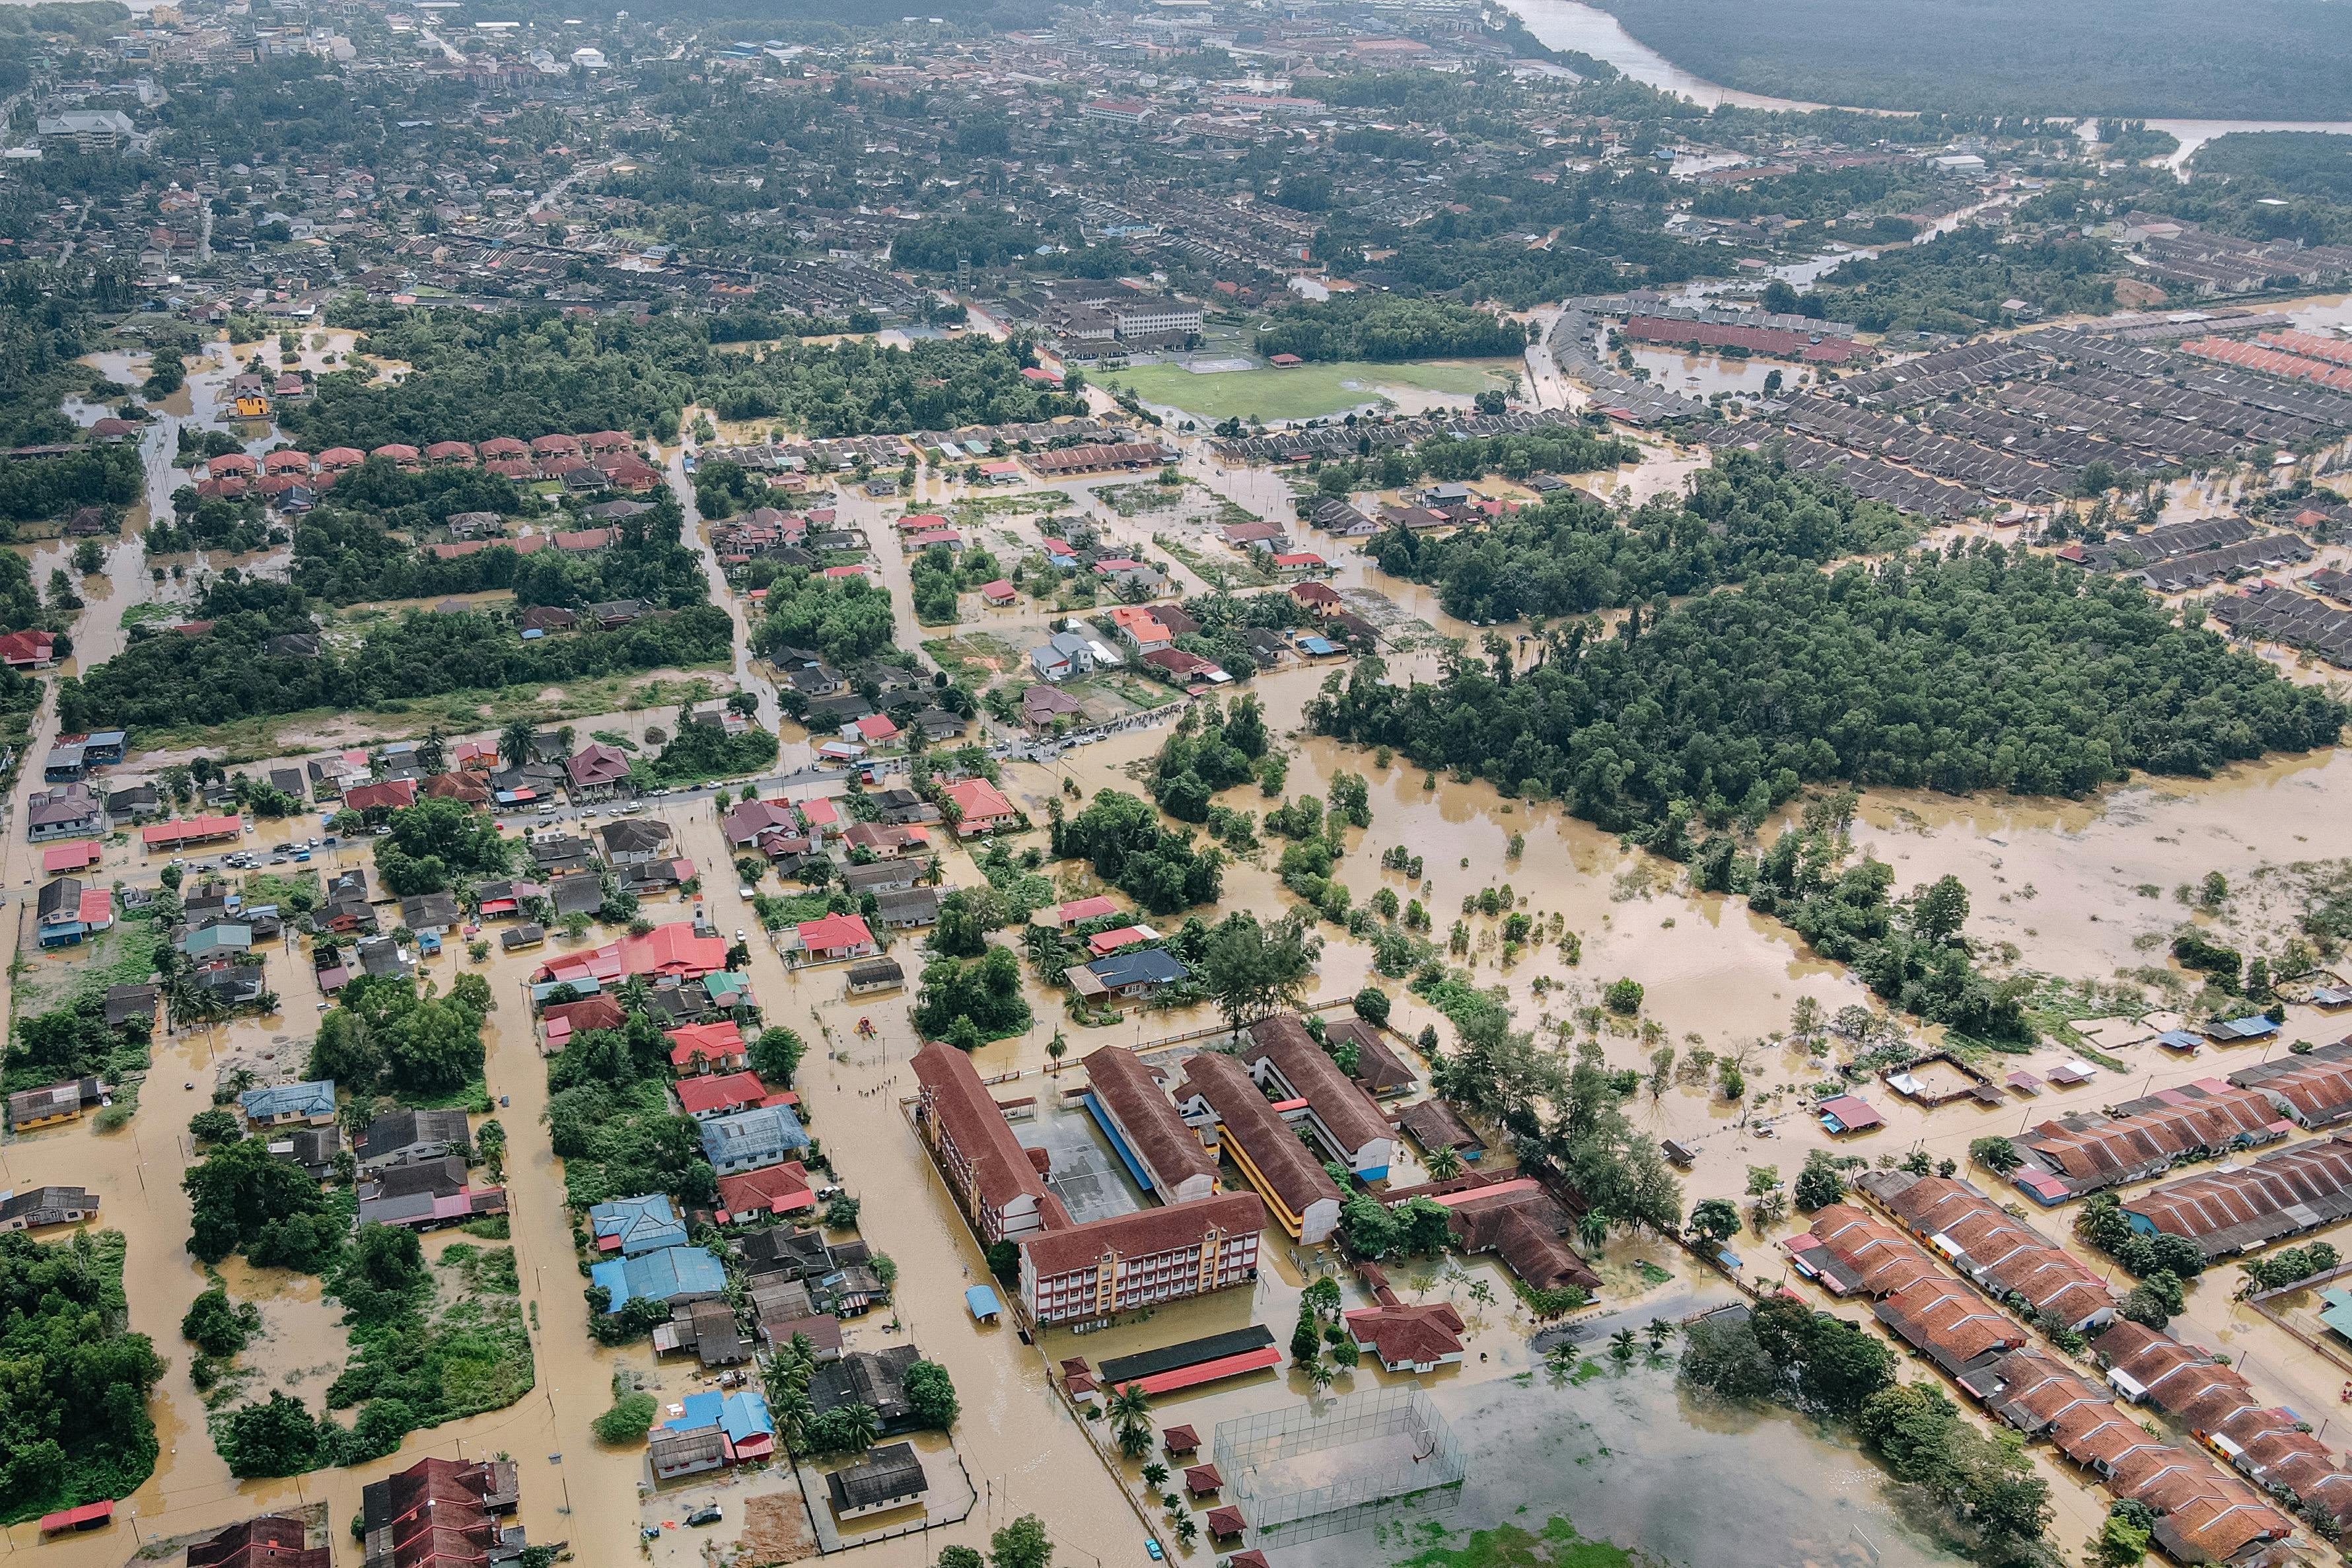
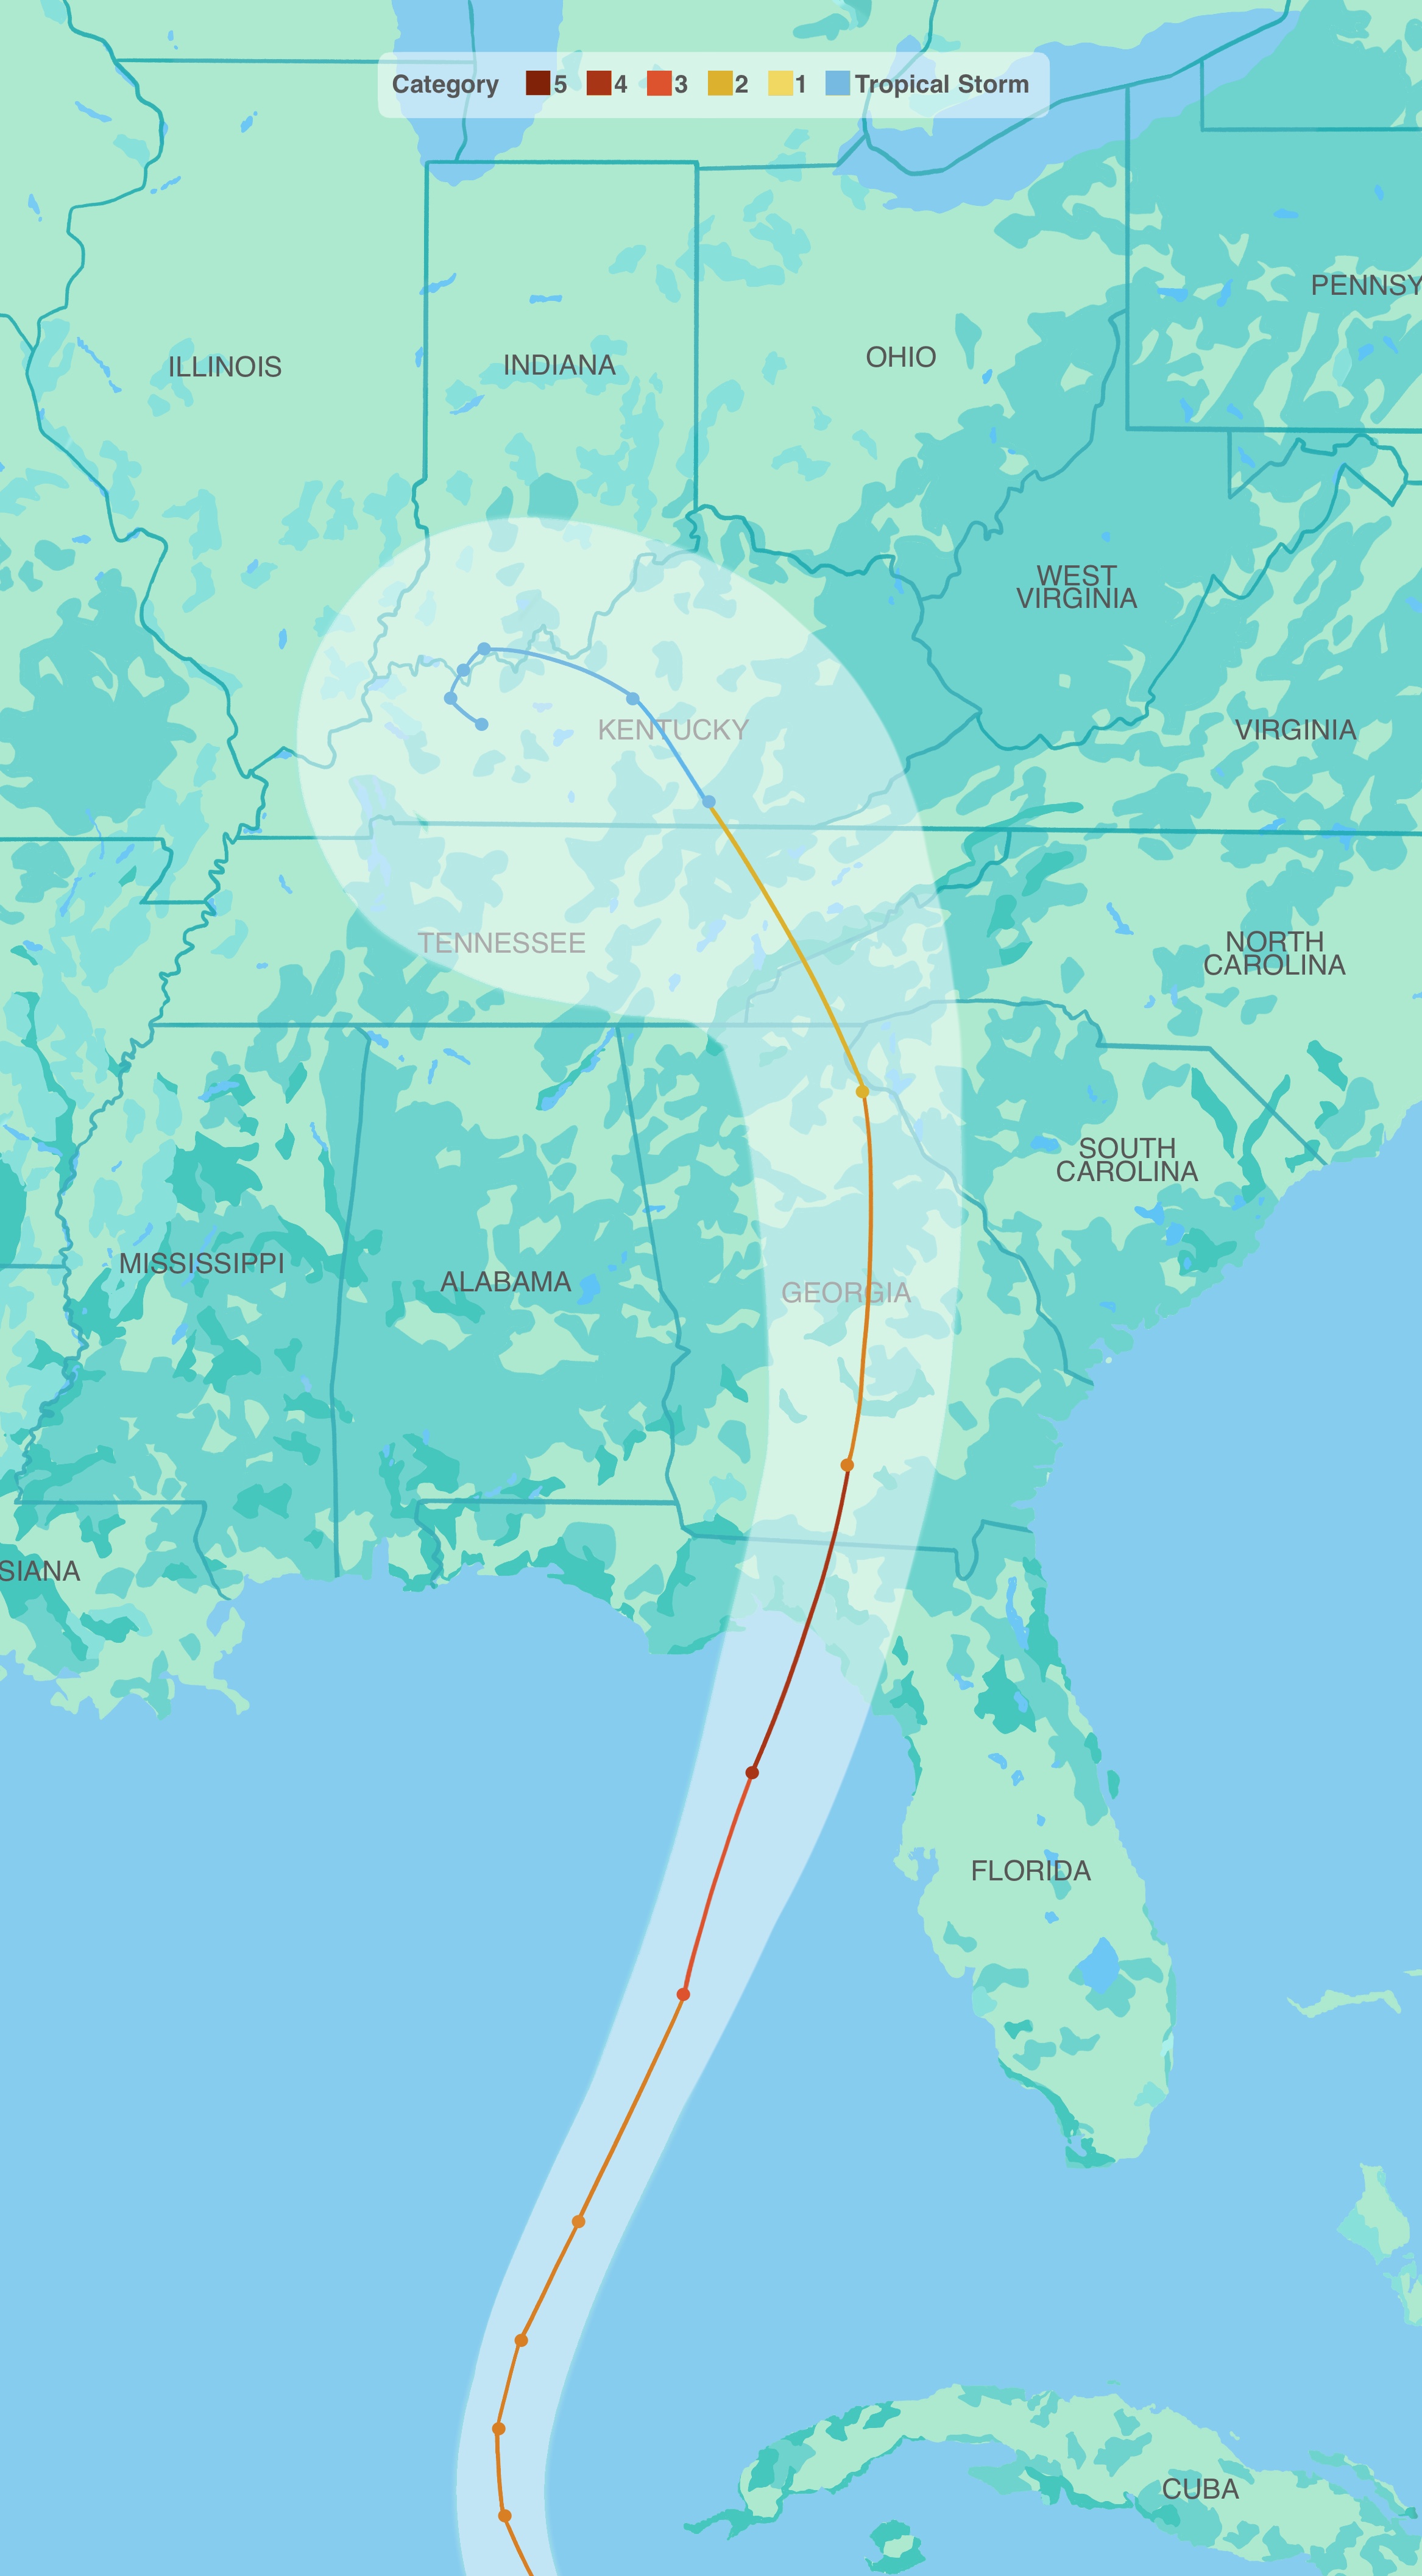
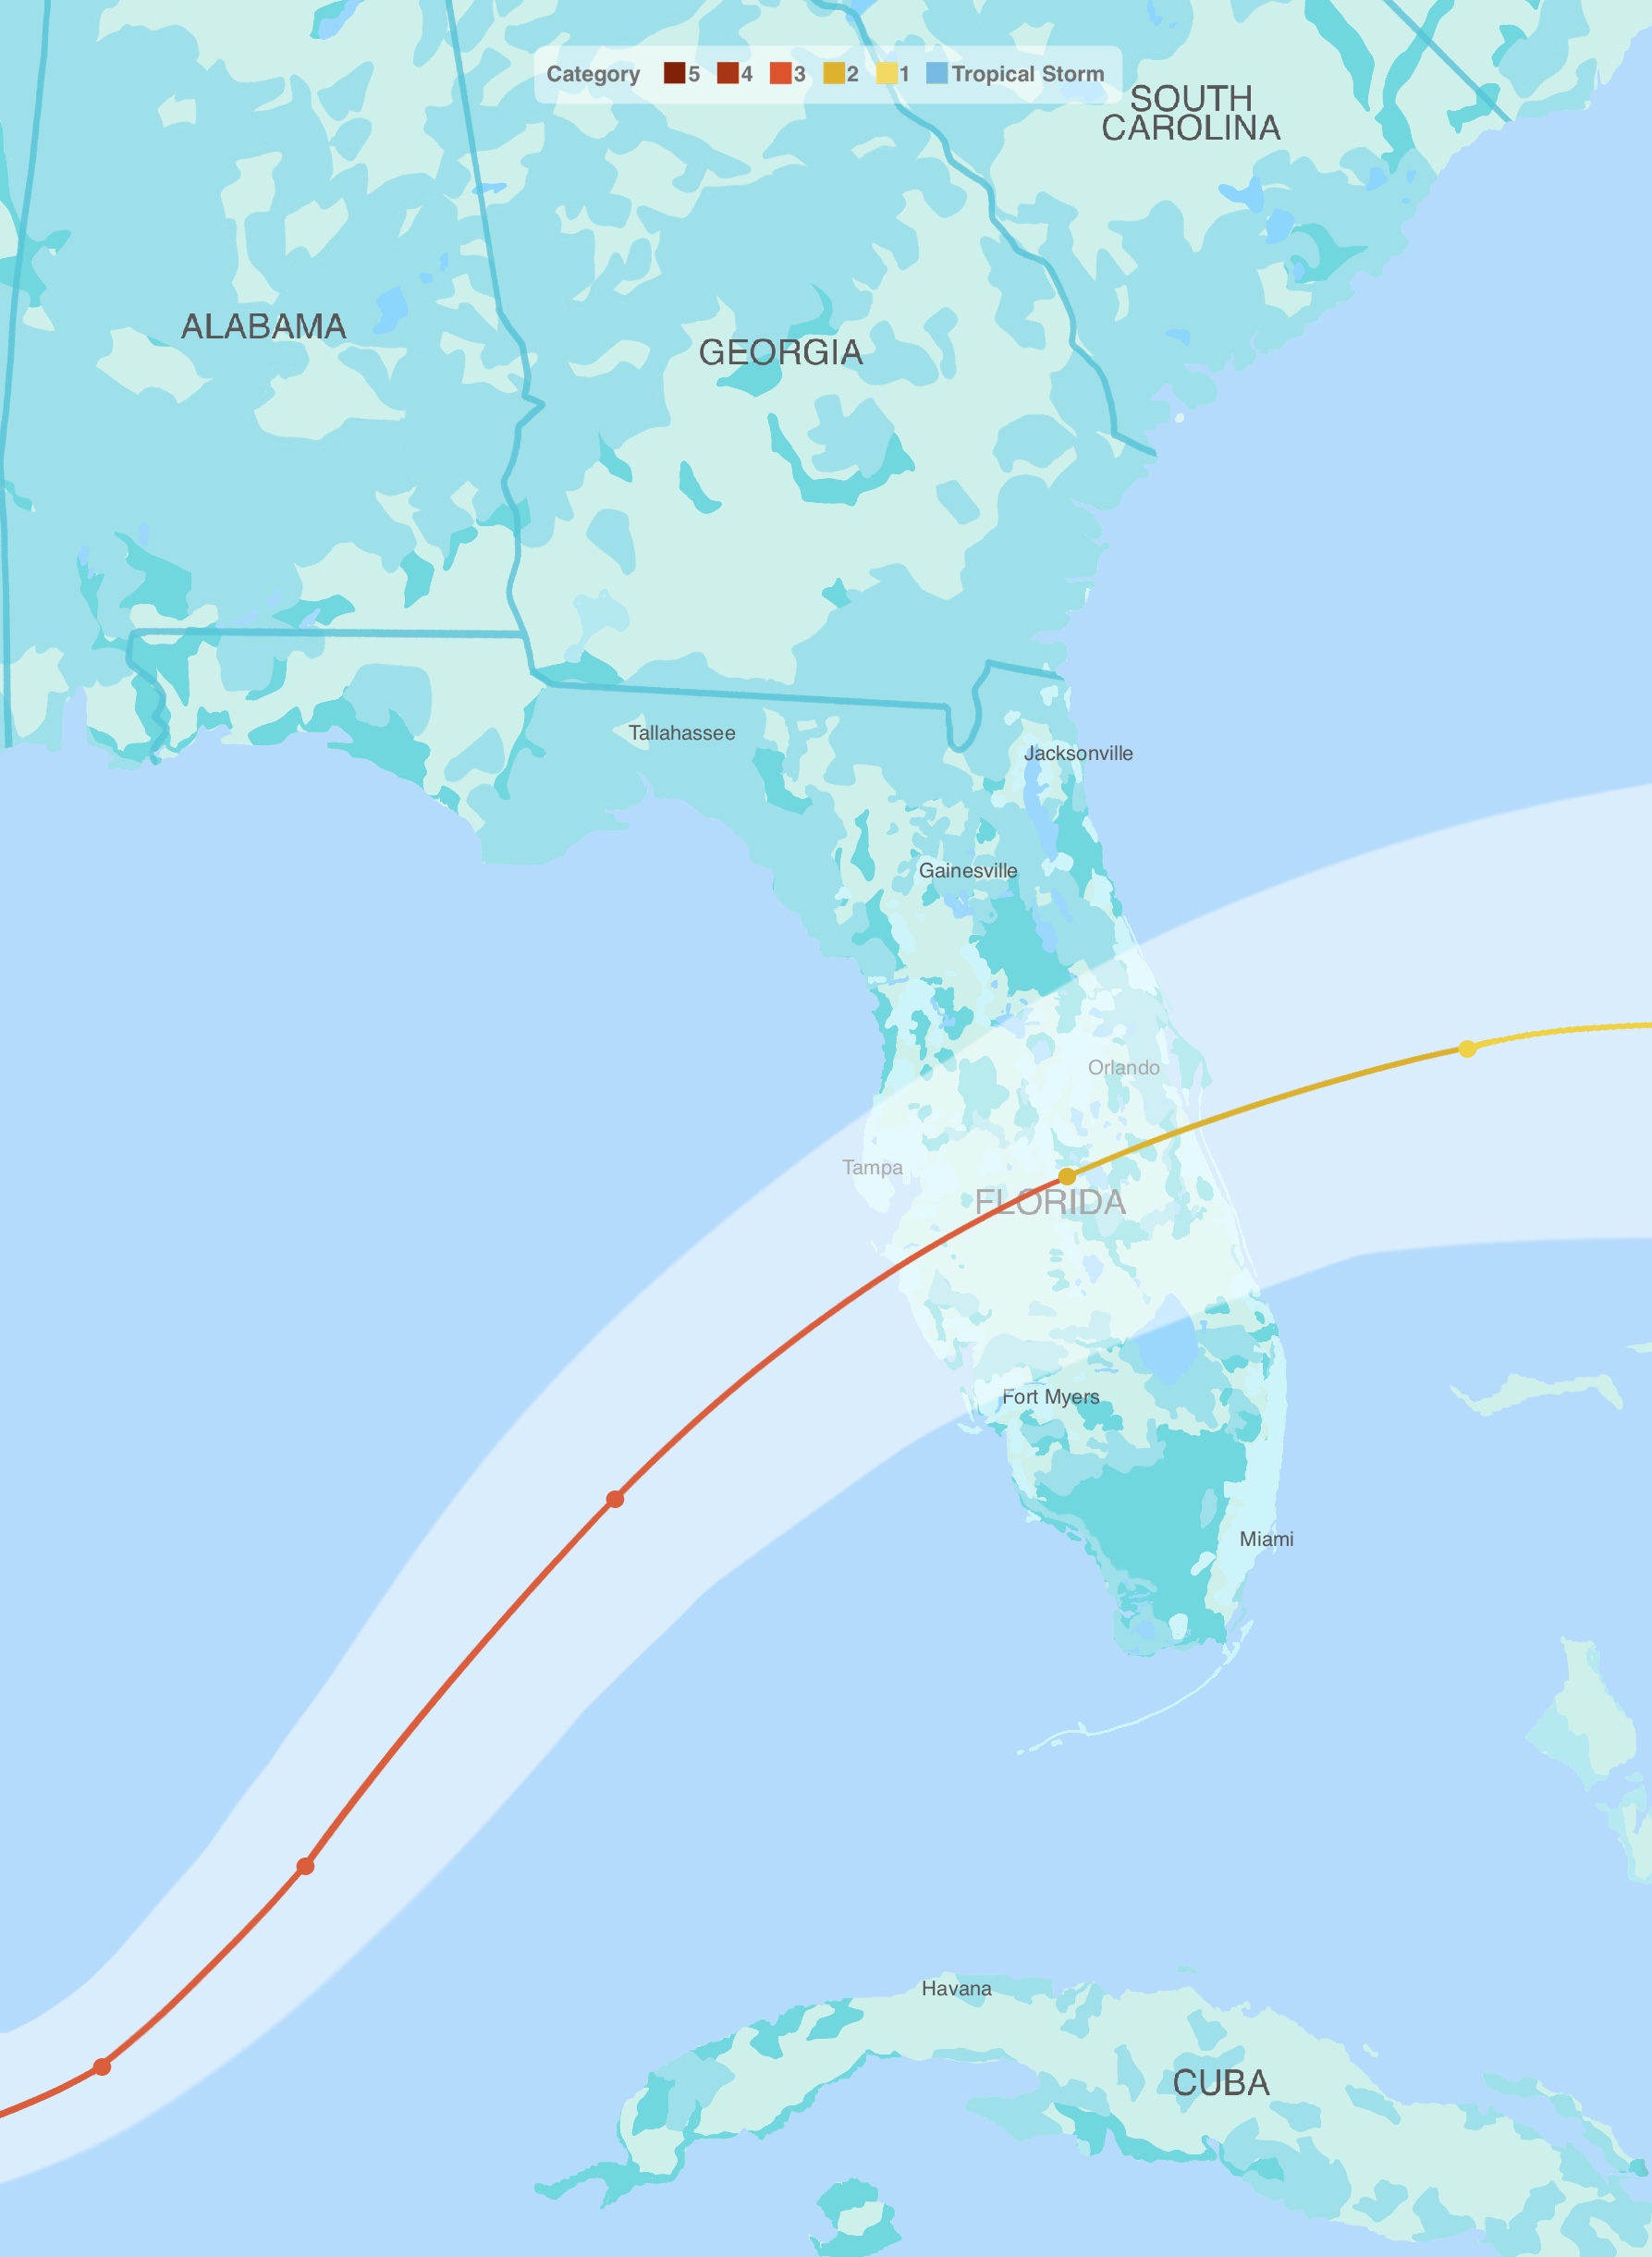
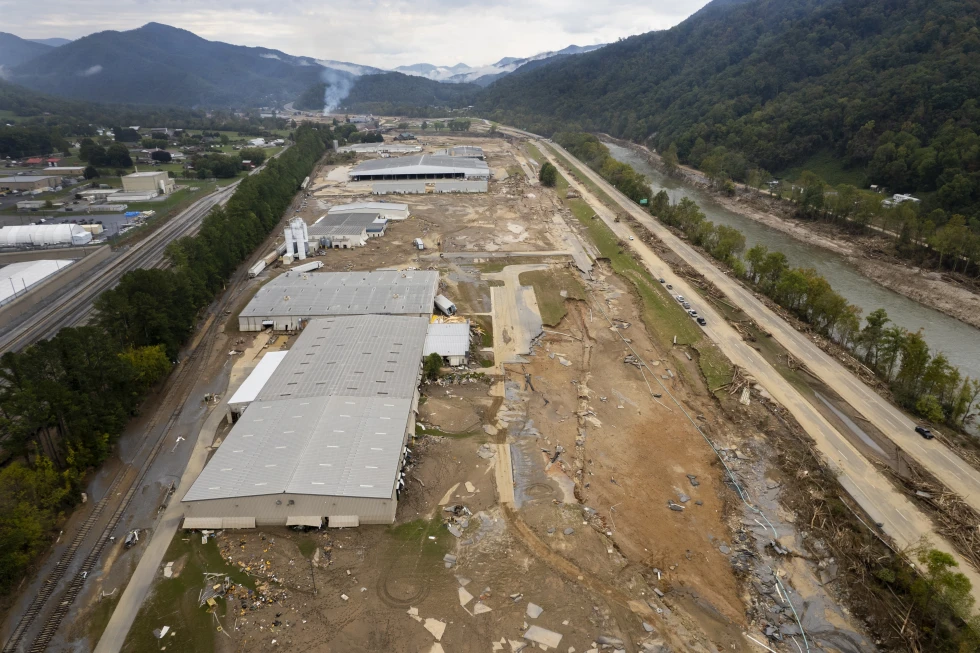
On the evening of September 24, 2024, Hurricane Helene made landfall in Florida's Big Bend area, impacting the region as a powerful Category 4 storm. Following this, on October 9, Hurricane Milton struck Florida as a Category 3 storm. Both hurricanes caused widespread damage and significant flooding throughout the state, severely affecting communities and infrastructure.


Please click the button below to check the paths and stories of Hurricane Helene and Milton.

Explore the history of flooding impacts across the nation with the map below, which visually represents significant flooding events from 1978 to 2022. The map illustrates net payments for building, contents, and ICC, excluding payment recoveries for building, contents, or ICC from all claims.


By going through these historical events, we gain a clearer understanding of the increasing frequency and severity of flooding, highlighting the critical need for preparedness and resilience in facing future challenges.


Please select specific states to focus on and view detailed information about the flooding events that occurred there.

Data Source: NFIP Significant Flood Events